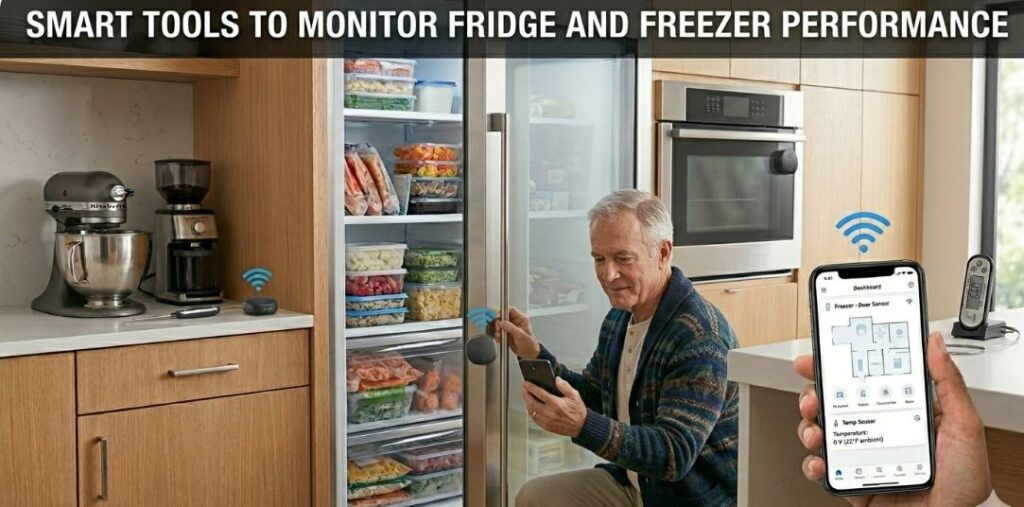
A refrigerator is the only home appliance that runs continuously — every hour of every day, whether you’re awake or asleep, home or away. Every other major appliance operates in defined cycles with clear start and end points.
The refrigerator never stops. And because it never stops, the gradual performance changes that indicate developing faults are easy to miss. The temperature that’s been drifting half a degree warmer each month. The compressor that’s been running five minutes longer per cycle for the past six weeks. The door seal that’s been losing integrity so slowly that nobody noticed until the vegetable drawer started accumulating condensation.
Periodic manual temperature checks catch obvious failures. What they miss is the gradual drift — the slow degradation that precedes every refrigerator fault and that continuous monitoring detects months before symptoms become undeniable. This is the gap that smart monitoring tools fill.
Modern smart tools to monitor fridge and freezer performance range from simple WiFi temperature sensors costing $15 to sophisticated whole-appliance monitoring systems that analyse compressor behaviour, door opening patterns, and energy consumption simultaneously. This guide covers the full range — what each tool monitors, what faults it catches, and which specific models are worth owning for home use.
Quick Reference: 8 Smart Tools to Monitor Fridge and Freezer Performance
| Tool | What It Monitors | Alert Capability | Data Logging | Price Range |
|---|---|---|---|---|
| WiFi temperature sensor | Compartment temperature | Yes — app push alerts | Yes — continuous | $15–$40 |
| Bluetooth temperature sensor | Compartment temperature | Yes — proximity alerts | Yes — up to 20 days | $25–$60 |
| Door open sensor | Door open duration and frequency | Yes | Yes | $10–$30 |
| Smart energy plug | Power consumption, cycling pattern | Yes — threshold alerts | Yes | $15–$40 |
| Wireless data logger | Temperature + humidity over time | Yes — threshold alerts | Yes — downloadable | $30–$120 |
| Thermal imaging camera | Surface temperature distribution | No — manual use | No | $150–$400 |
| Smart home hub integration | Multi-sensor unified monitoring | Yes | Yes | $50–$150 |
| Compressor vibration sensor | Compressor operation detection | Yes | Yes | $20–$50 |
Why Continuous Monitoring Changes the Diagnostic Game
Manual temperature checking — opening the fridge, placing a thermometer, recording a reading — gives you a single data point at a single moment. That data point tells you what temperature the compartment was at the time you checked. It tells you nothing about what the temperature was at 3am, during the warmest part of the afternoon, during the defrost cycle, or for the 23 hours and 57 minutes between checks.
The Problem with Snapshot Measurements
Refrigerator faults don’t always produce constant temperature deviations. A defrost system that’s running correctly most of the time but allowing temperature to spike during extended defrost cycles produces an average temperature that looks normal while briefly exposing food to unsafe temperatures. A door gasket that seals adequately under normal household humidity but fails when afternoon humidity rises above 65% causes temperature excursions only during specific ambient conditions.
Both of these faults are invisible to periodic manual checks and clearly visible in continuous monitoring data. The temperature log shows the spike. The timing shows whether it correlates with a defrost cycle, a time of day, or ambient conditions. That correlation is the diagnosis — it identifies both the fault and its cause simultaneously.
The Value of Trend Data
Beyond catching specific fault events, continuous monitoring reveals trends that indicate developing problems before they cause measurable temperature deviations. A compressor that ran 22 minutes per hour in January, 26 minutes in February, and 31 minutes in March is losing efficiency progressively — even if the compartment temperature remains correct throughout. The trend data identifies this before the compressor struggles to maintain temperature.
A smart energy plug on the refrigerator’s power cord captures this cycling pattern automatically. The compressor’s on-off signature shows clearly in the power consumption log — high wattage when running, low standby wattage when off. Tracking the ratio over weeks reveals efficiency trends that no other monitoring method provides without specialised equipment.
Tool 1: WiFi Temperature Sensors
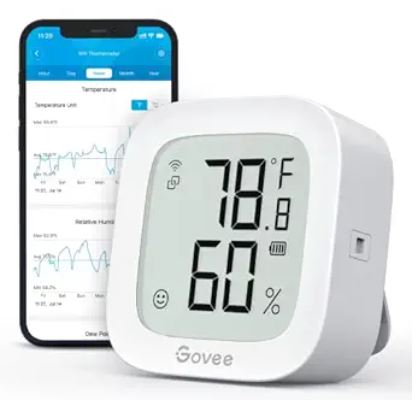
A WiFi temperature sensor is the foundation of smart refrigerator monitoring — the tool that turns a passive appliance into an actively monitored system. It transmits real-time temperature data to a smartphone app continuously, alerts you when temperature exceeds defined thresholds, and logs historical data for pattern analysis.
How They Work
The sensor placed inside the refrigerator connects to your home WiFi network and transmits temperature readings to a cloud server at regular intervals — typically every 1–5 minutes. The companion app displays current temperature, historical graphs, and sends push notifications when temperature goes outside the range you define.
For a refrigerator, set the alert range to 33–42°F. Any reading outside this range triggers an immediate notification regardless of time of day or your location. This catches door-left-open events, power outages, compressor failures, and defrost system faults the moment they affect compartment temperature — not hours later when food damage has already occurred.
Placement for Accuracy
Position the sensor at mid-height in the fresh food compartment, away from the air vents and at least 6 inches from the door. This location gives the most representative ambient air temperature reading — away from the cold air outlet that would read artificially cold and away from the door where warm air infiltration produces artificially warm readings.
Place a second sensor in the freezer compartment set to alert below 15°F and above 10°F. Two sensors — one per compartment — cost $30–$40 total and provide complete compartment monitoring for both the fridge and freezer simultaneously.
Recommended:
- Govee WiFi Temperature Sensors (View on Amazon)
- Inkbird WiFi Temperature Sensors (View on Amazon)
Tool 2: Bluetooth Temperature Sensors with Data Logging
Bluetooth sensors don’t require WiFi connectivity — they store temperature data locally on the device and sync to a smartphone app via Bluetooth when in range. This makes them useful in locations where WiFi signal is weak or in households that prefer not to connect monitoring equipment to the home network.
Recommended: SensorPush Bluetooth Temperature Sensors (View on Amazon)
Tool 3: Smart Energy Plugs for Compressor Monitoring
A smart energy plug installed on the refrigerator’s power cord monitors compressor cycling patterns through power consumption — the most indirect but most continuously informative indicator of refrigerator performance health available without any internal instrumentation.
Reading Compressor Cycles in Power Data
A refrigerator draws two distinct power levels — a higher level when the compressor runs (typically 100–200 watts depending on the model) and a very low standby level when the compressor is off (typically 5–15 watts for the control board and interior lighting). The smart plug’s power log shows this as a regular square-wave pattern — periods of higher consumption alternating with periods of near-zero consumption.
The diagnostic value lies in the ratio and the trend. A refrigerator with correctly functioning insulation, seals, and refrigeration system runs its compressor for roughly 30–40% of the time under typical household conditions. A compressor running 60–70% of the time — visible as a changed ratio in the power log — indicates the refrigerator is working significantly harder than normal.
Tracking Efficiency Trends
Log the compressor run percentage monthly and track the trend. A gradual increase over months indicates progressive efficiency loss — from dirty condenser coils, a degrading door seal, or early compressor wear — even when compartment temperature remains correct. This trend-based early warning gives you months of lead time to address the underlying cause before the compressor fails or food safety is compromised.
Catching Defrost Cycle Anomalies
The automatic defrost cycle appears in the power log as a distinct signature — a period when the compressor stops and a lower-wattage heating element runs to melt frost from the evaporator coil. A correctly functioning defrost cycle lasts 20–30 minutes every 6–12 hours. A defrost cycle that runs longer than 30 minutes indicates a defrost thermostat issue. A cycle that doesn’t appear in the log at all indicates a failed defrost timer or heater. Both are clearly visible in the energy consumption log without opening the appliance.
Recommended: Kasa EP25 Smart Plugs (View on Amazon)
Tool 4: Wireless Data Loggers
A wireless data logger is a more industrial-grade version of the Bluetooth temperature sensor — designed for applications where data integrity, accuracy, and download capability matter more than consumer convenience. They’re used in pharmaceutical cold chain monitoring, food service compliance, and laboratory applications — but their accuracy and reliability translate directly to serious home appliance monitoring.
Advantages Over Consumer Sensors
Professional data loggers typically offer tighter accuracy specifications (±0.2°F vs ±0.5–1°F for consumer sensors), longer logging intervals (up to 1 year at hourly intervals on a single battery), and downloadable data files in formats compatible with spreadsheet analysis. For diagnosing subtle temperature deviations or documenting appliance performance over extended periods, the data quality is meaningfully better than consumer WiFi sensors.
Elitech RC-51H
The Elitech RC-51H is a widely used USB data logger that stores 32,000 readings, downloads directly to a computer via USB, and generates PDF and Excel reports automatically. At $25–$40 it bridges the gap between consumer sensors and professional-grade instruments. For a household that wants spreadsheet-level data analysis of refrigerator temperature performance over a month or more, the RC-51H provides data quality that app-based consumer sensors can’t match.
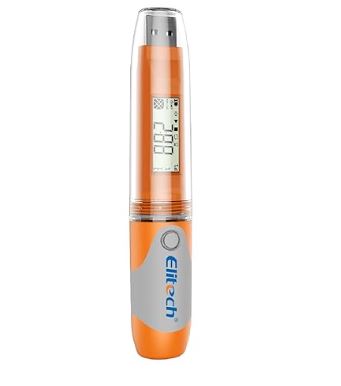
Recommended: Elitech RC-51H USB Temperature Data Logger (View on Amazon)
Tool 5: Door Open Sensors
A door open sensor monitors how frequently the refrigerator door is opened, how long it stays open each time, and whether it’s been left ajar — alerting you when the door has been open beyond a defined duration threshold. This addresses one of the most common causes of intermittent temperature excursions that puzzles homeowners monitoring temperature alone.
Why Door Behaviour Matters
Every door opening introduces a pulse of warm room air into the refrigerator compartment. A door opened 40 times in a day has a meaningfully higher thermal load than one opened 15 times. A door left slightly ajar for 20 minutes — common in households with young children or when shelves are overloaded near the door — allows continuous warm air infiltration that raises compartment temperature and forces extended compressor operation.
When a temperature sensor shows unexplained temperature excursions, correlating those events with door open sensor data often reveals a behavioural cause — the door left open by a specific household member, a specific time of day, or a specific shelf arrangement that prevents complete closure — that no refrigeration fault diagnostic would identify.
Integration with Temperature Monitoring
The most diagnostic use of a door open sensor is running it simultaneously with a temperature sensor and correlating the two logs. A temperature spike that consistently follows a specific door open event pattern confirms the behavioural cause. A temperature spike that occurs with no corresponding door open event confirms an internal fault — defrost system, gasket, or compressor issue — rather than a usage pattern problem.
The Govee Door and Window Sensor integrates with the Govee app alongside Govee temperature sensors — allowing unified monitoring of door behaviour and compartment temperature in a single interface. It alerts after the door has been open for a user-defined duration — 1, 2, 5, or 10 minutes — with an audible alarm and app notification.
Tool 6: Thermal Imaging Camera
A thermal imaging camera used periodically — monthly or quarterly — provides a whole-appliance thermal picture that sensor-based monitoring can’t replicate. Where temperature sensors measure air temperature at specific points, a thermal camera maps the full temperature distribution across every external surface of the refrigerator simultaneously.
What It Reveals That Sensors Miss
A degrading door gasket shows as a warm intrusion along the door edge — visible as a colour anomaly in the thermal image before any temperature sensor inside the compartment detects its effect. Damaged or moisture-compromised insulation in the wall panels shows as warmer exterior surface patches. A condenser coil running hotter than normal — indicating restriction from dust accumulation — shows clearly in a thermal scan of the rear or underside of the appliance.
These are surface-based thermal signatures that a temperature sensor inside the compartment never directly measures. The sensor tells you what the air temperature is. The thermal camera tells you why it’s changing — by showing where cold is escaping and where heat is entering the appliance.
Practical Use Schedule
A thermal camera scan of the full refrigerator exterior — all four sides, top, and the rear condenser area — takes under 5 minutes and reveals any developing insulation or gasket fault at its earliest stage. Quarterly scans create a visual record that makes changes visible even when they’re too subtle to detect in a single observation.
Recommended: FLIR ONE Pro Thermal Cameras (View on Amazon)
Building a Complete Smart Monitoring System
A complete fridge and freezer monitoring system uses multiple tools simultaneously — each monitoring a different aspect of performance that the others don’t cover.
| Monitoring Layer | Tool | What It Catches |
|---|---|---|
| Compartment temperature | WiFi sensor (Govee H5074) x2 | Temperature deviations, defrost cycle spikes |
| Humidity | Inkbird IBS-TH2 Plus | Interior humidity contributing to frost accumulation |
| Compressor cycling | Smart energy plug (Kasa EP25) | Efficiency trends, defrost cycle anomalies |
| Door behaviour | Govee door sensor | Door-related temperature excursions |
| Surface thermal condition | FLIR ONE Pro (quarterly) | Gasket integrity, insulation faults, condenser condition |
| Long-term data | Elitech RC-51H | Detailed historical records for extended analysis |
The entry-level version of this system — WiFi temperature sensors in both compartments and a smart energy plug on the power cord — costs under $60 total and provides continuous monitoring of both compartment temperature and compressor behaviour. This two-layer system catches the majority of significant refrigerator faults at their earliest detectable stage.
What Normal Fridge and Freezer Performance Looks Like
Before you can identify abnormal performance, you need to know what normal looks like. Use this reference to evaluate your monitoring data.
| Parameter | Normal Range | Abnormal Indication |
|---|---|---|
| Refrigerator temperature | 35–38°F | Above 40°F or below 32°F |
| Freezer temperature | -5°F to 5°F | Above 10°F |
| Temperature stability | ±2°F variation | ±5°F or greater variation |
| Compressor run ratio | 30–40% of time | Above 55% consistently |
| Defrost cycle duration | 20–30 minutes | Above 40 minutes or absent |
| Defrost cycle frequency | Every 6–12 hours | More frequent than 4 hours |
| Post-defrost temp spike | +3 to +5°F maximum | +10°F or greater |
| Door open duration | Under 30 seconds typical | Alerts above 2 minutes |
Frequently Asked Questions
What is the most important smart tool for monitoring refrigerator performance?
A WiFi temperature sensor with app alerts and continuous data logging is the single most important smart monitoring tool for a refrigerator. It provides the continuous compartment temperature data that periodic manual checks miss — catching temperature excursions from door-left-open events, power outages, defrost system faults, and compressor failures the moment they affect compartment temperature. The Govee H5074 at $15–$20 is the best value entry point and provides more diagnostic value per dollar than any other refrigerator monitoring tool.
How do I know if my fridge compressor is running too much?
A smart energy plug on the refrigerator’s power cord shows compressor cycling in its power consumption log. Normal compressor run time is approximately 30–40% of total time under typical household conditions. If your monitoring shows the compressor running more than 55% of the time consistently — after ruling out recent door use or ambient temperature changes — the refrigerator is working harder than it should. Clean the condenser coils first, check the door gaskets, and verify that compartment temperature is correctly set before investigating further faults.
Can smart monitoring tools replace periodic manual inspection?
Smart sensors and energy plugs replace the need for periodic manual temperature checks and provide significantly better coverage than manual methods could practically achieve. They don’t replace physical inspection of components — condenser coils, door gaskets, drain channels, and mechanical parts still require periodic visual inspection and cleaning that no remote monitoring tool substitutes for. The best maintenance approach combines continuous sensor monitoring for performance data with periodic physical inspection for component condition.
What temperature range should I set my smart sensor alerts for?
For the fresh food compartment, set the alert range to 32–42°F — alerting below 32°F prevents freezing damage to fresh produce and above 42°F alerts to food safety risk. For the freezer compartment, set the alert range to -10°F to 15°F — alerting above 15°F gives you early warning of a temperature fault while providing enough margin to avoid false alerts from normal door-open temperature recovery. Adjust these ranges based on your appliance’s normal operating temperatures once you’ve established a monitoring baseline.
Do I need both WiFi and Bluetooth sensors or just one type?
WiFi sensors provide remote monitoring and immediate alerts regardless of your proximity to the appliance — which is their primary advantage for food safety protection. Bluetooth sensors provide higher data accuracy and don’t require internet connectivity — which matters if your WiFi signal is weak in the appliance location. For most households, WiFi sensors cover the primary use case. Consider adding a Bluetooth data logger if you want higher accuracy, longer data retention, or coverage in a location where WiFi signal is unreliable.
How does a smart energy plug help monitor freezer performance specifically?
A smart energy plug on a chest freezer or upright freezer shows compressor cycling patterns that indicate whether the appliance is maintaining temperature efficiently. A chest freezer is inherently more efficient than an upright model because its well-insulated lid minimises cold air escape when opened — this should show as a lower compressor run ratio in the energy log compared to an equivalent upright model. Any increase in run ratio over time indicates degrading efficiency from a gasket fault, insulation compromise, or condenser restriction. The energy log captures this trend automatically without any manual monitoring effort.
What should I do if my temperature sensor shows a regular daily spike?
A temperature spike that occurs at the same time each day — typically in the early hours of the morning — is almost always the automatic defrost cycle. This is normal behaviour. The spike should be no more than 3–5°F above the normal compartment temperature and should resolve within 30–45 minutes as the compressor restores temperature after the defrost cycle ends. A spike of 10°F or more, a spike lasting more than an hour, or a spike occurring more than three times in 24 hours indicates a defrost system fault — either the defrost heater running too long, the defrost thermostat not terminating the cycle correctly, or the defrost timer cycling too frequently.
Relevant:
- Best Home Appliance Diagnostic Tools Worth Buying
- Essential Home Appliance Repair Tools Worth Getting
Conclusion
Smart monitoring tools transform refrigerator and freezer maintenance from reactive to proactive. Instead of discovering that the fridge has been running warm for an unknown period when food spoils, you receive an alert the moment temperature deviates. Instead of noticing that the electricity bill has increased without knowing why, the smart energy plug shows you the compressor running ratio that explains it. And instead of replacing a compressor that failed without warning, you see the efficiency trend that preceded the failure and address its cause in advance.
Start with two WiFi temperature sensors — one in each compartment — and a smart energy plug on the power cord. Under $60 total, this three-tool system provides continuous temperature monitoring with remote alerts, compressor cycling pattern data, and defrost cycle visibility that covers the majority of significant refrigerator faults at their earliest detectable stage.
Add a door sensor if temperature excursions correlate with door use patterns you want to understand. Add a data logger for detailed long-term records. Then add a thermal camera for quarterly surface condition assessments. Build the system in layers as your monitoring needs reveal themselves — and let the data tell you what’s happening inside your appliance before the food or the appliance pays the price of finding out too late.
Browse smart fridge and freezer monitoring tools on Amazon and start monitoring the appliance that never stops working.

Hi, I’m Barlgan! I created Repair Me Yourself to empower homeowners to tackle appliance repairs with confidence. From decoding error codes to fixing cooling issues, I break down complex repairs into simple, actionable steps that save you time and money.